How to use the Moody graphs without overreading your data
Moody graphs are designed to make your history easier to review, not to turn your mood into a scorecard.
Quick answer
Moody users want to know what the graph tabs mean and how to read them without overinterpreting personal mood data.
Use the overview to orient yourself
Start with the broad view before opening detailed charts. The overview helps you understand the selected period: how many entries exist, how the mood distribution looks, and whether the period feels steady or uneven.
This first pass matters because it prevents overreacting to one chart. The overview gives you context before you look for explanations.
Read trends as direction, not destiny
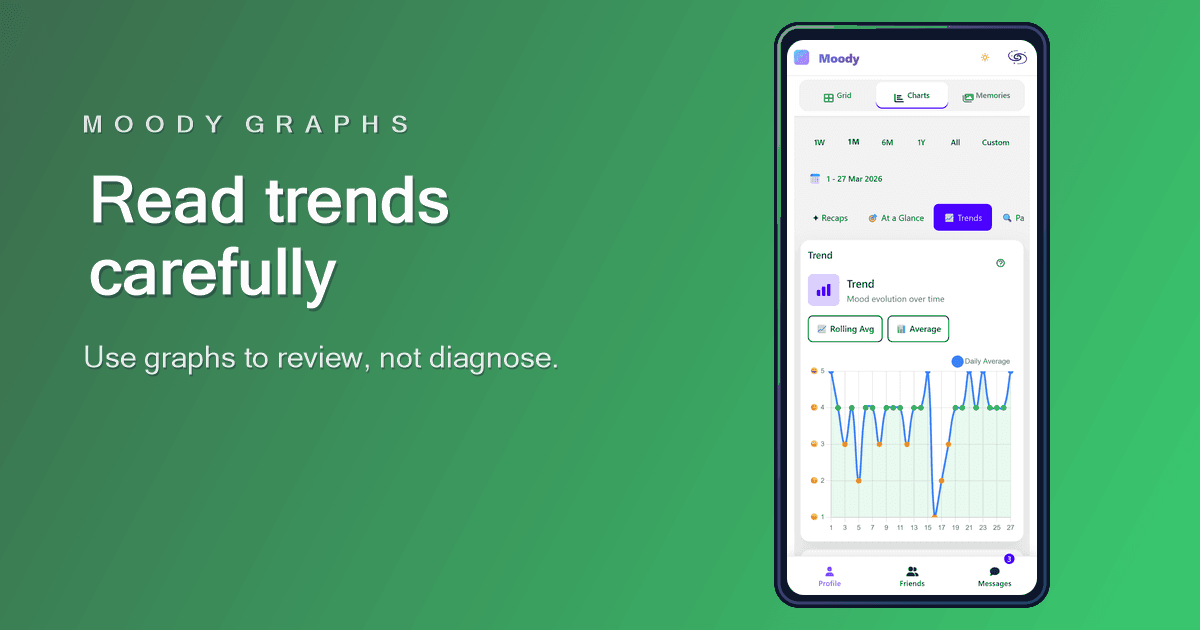
Trend charts show movement over time. They are useful for seeing whether a period was rising, falling, stable, or irregular. They do not prove why that movement happened.
When a trend catches your attention, return to the entries behind it. The chart shows the signal. The notes, photos, and context help explain it.

Use pattern views carefully
Pattern views can highlight repeated associations, but they should be read with caution. Missing entries, unusual weeks, and inconsistent timing can all affect the result.
Use these views to form practical questions. For example: do low entries often happen after poor sleep? Do better entries often include outdoor time? Is this still true if I review another month?
Keep the graph connected to real life
The best use of Moody graphs is grounded and modest. Notice a signal, check the entries, write down a question, and choose one small next step if it feels useful.
Moody graphs are for reflection. They are not medical analysis, diagnosis, or a replacement for professional support.
FAQ
Start a clearer mood history
Moody graphs help you review your history with context, caution, and clear next questions.
Read other articles
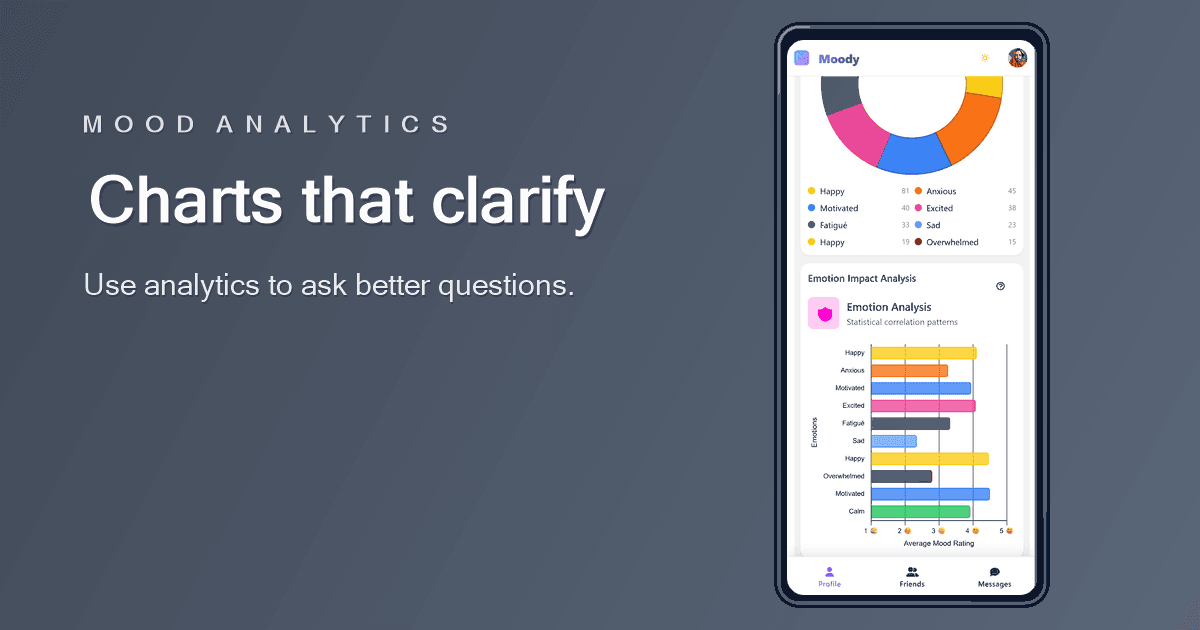
What a mood tracker with analytics should actually help you understand
Good mood analytics do not tell you who you are. They help you ask better questions about your recent days.
Read article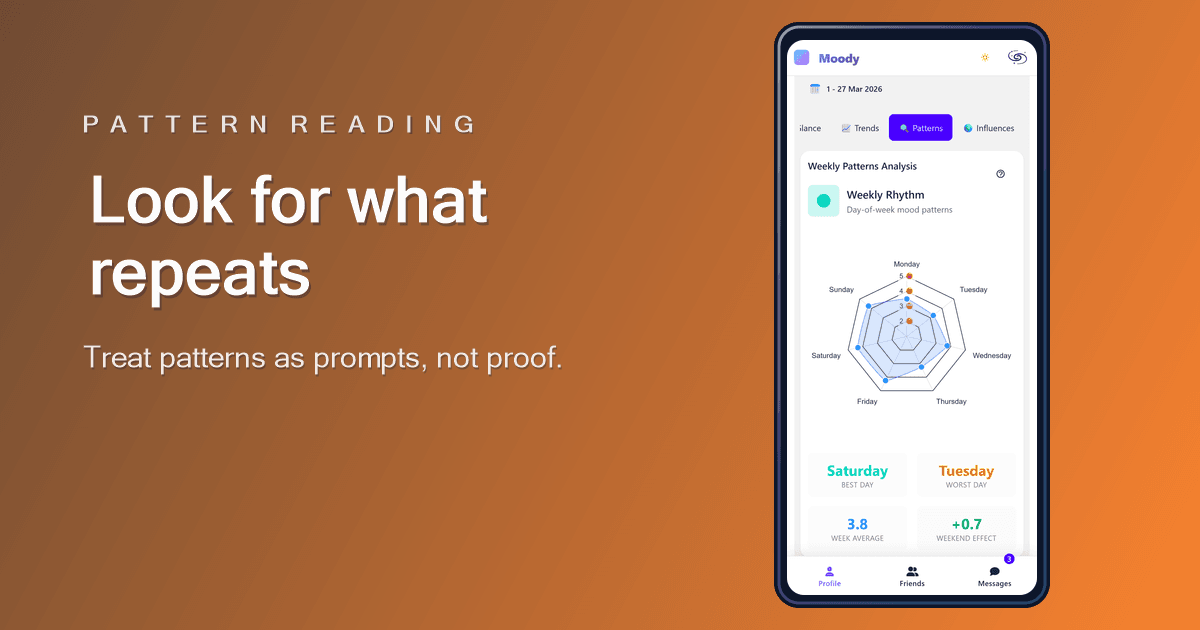
How to spot patterns in your mood data without forcing them
A real pattern repeats. A single memorable day is just a day until the history gives it context.
Read article
How to review your week with a mood tracker in 10 minutes
A weekly review should help you understand the shape of the week, not turn your mood history into a performance report.
Read article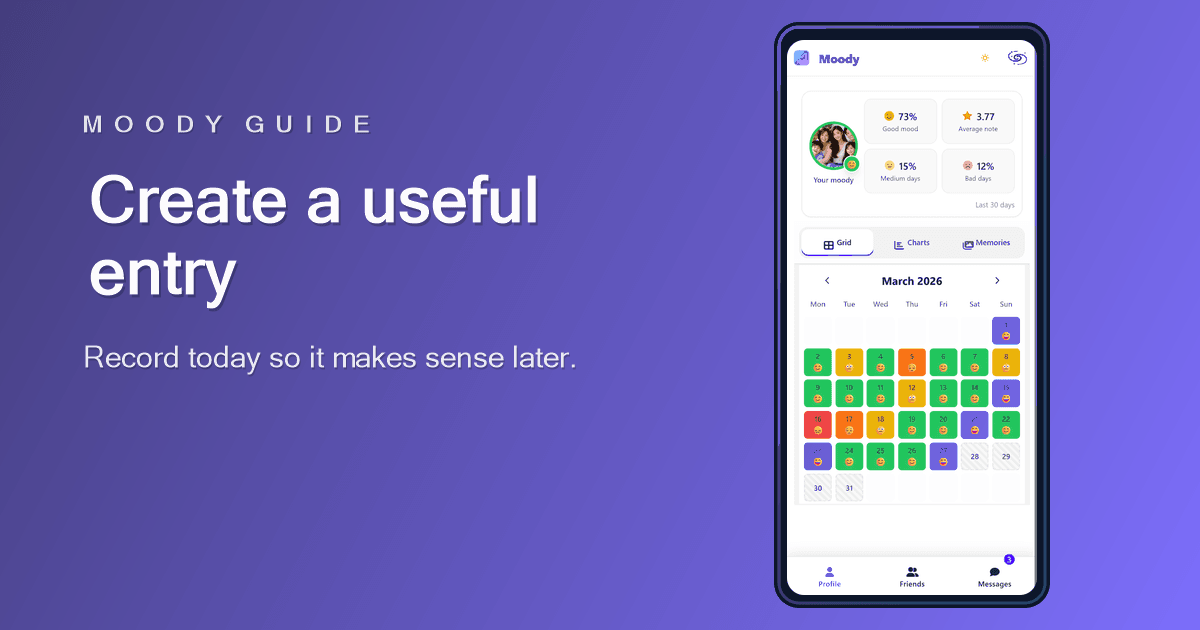
Create a Moody entry that stays useful later
A good Moody entry is quick to create today and easy to understand when you review it later.
Read article